记录下如何使用pprof
进程开启pprof
修改代码,增加pprof的import,并监听端口
import (
	"net/http"
	_ "net/http/pprof"
)

func main(){
    go http.ListenAndServe("0.0.0.0:8080", nil)
    // do other things
}
进行30秒的cpu profile,并生成profile文件
$ go tool pprof http://10.199.151.41:8080/debug/pprof/profile
Fetching profile over HTTP from http://10.199.151.41:8080/debug/pprof/profile
Saved profile in C:\Users\arloor\pprof\pprof.mtrace-collector.samples.cpu.001.pb.gz
File: mtrace-collector
Type: cpu
Time: Jun 2, 2022 at 12:10am (CST)
Duration: 30.14s, Total samples = 6.42s (21.30%)
Entering interactive mode (type "help" for commands, "o" for options)
(pprof) web
(pprof)
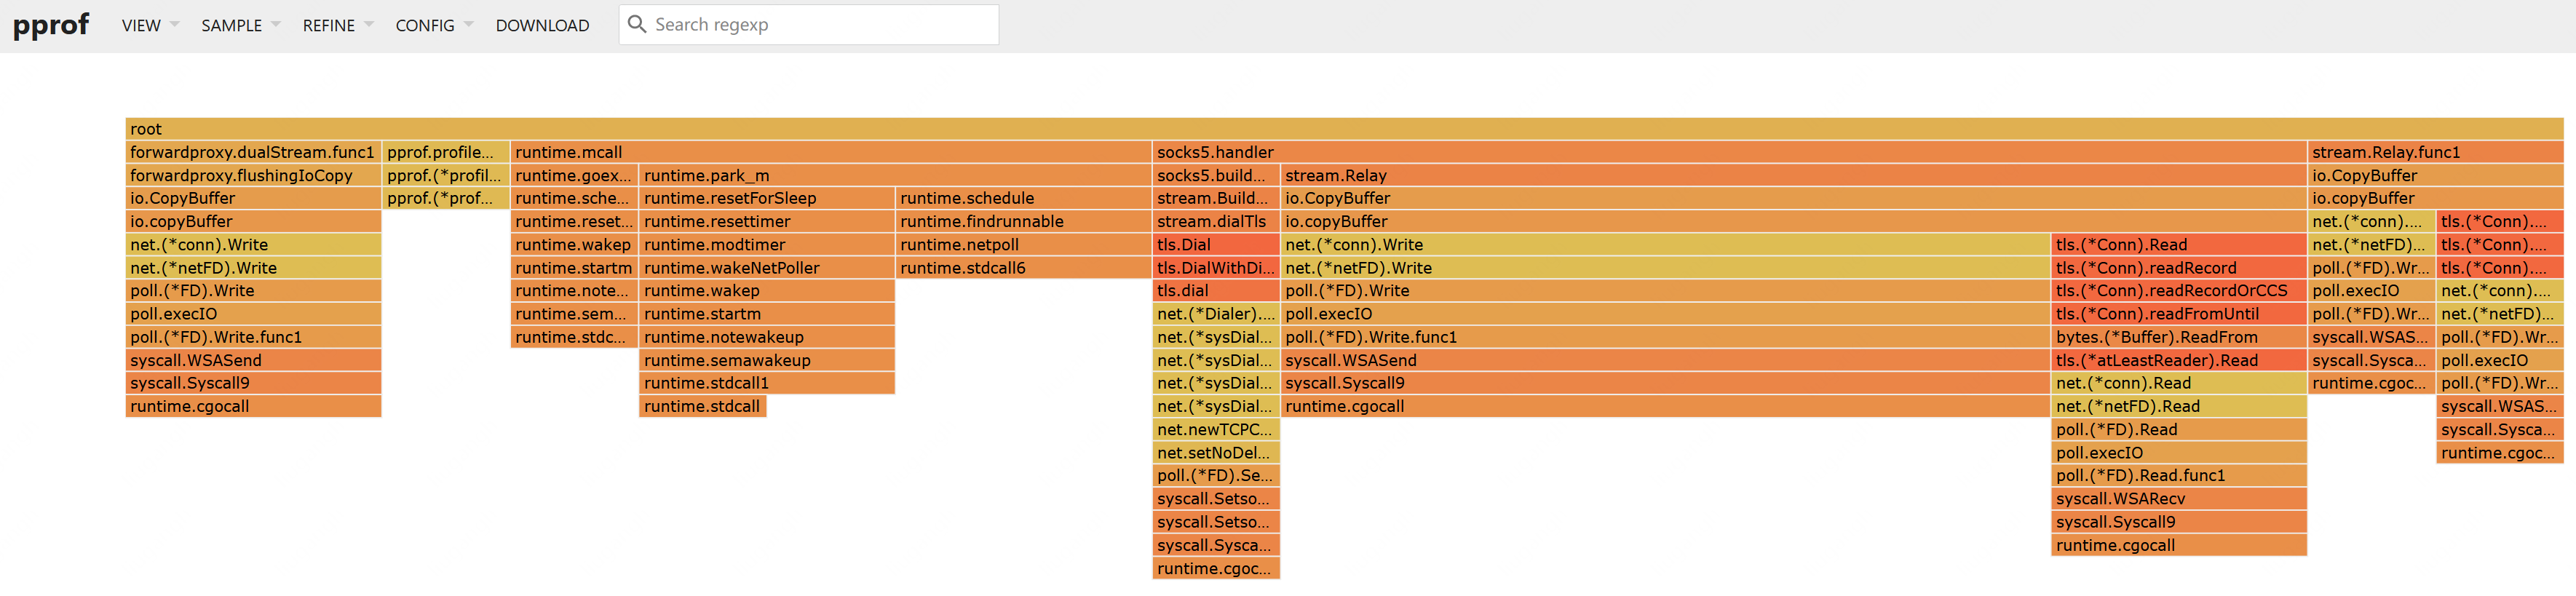
使用pprof和graphviz对cpu profile提供更好的可视化
graphviz安装见https://graphviz.org/download/
$ go install github.com/google/pprof@latest
$ pprof -http=:6060 C:\Users\arloor\pprof\pprof.mtrace-collector.samples.cpu.001.pb.gz
Serving web UI on http://localhost:6060
$ pprof -http=:6060 http://localhost:9999/debug/pprof/profile
Fetching profile over HTTP from http://localhost:9999/debug/pprof/profile
火焰图效果: