
trace详情搜索性能优化
现状
当前根据traceId点查trace详情的耗时很长,有两个影响:
- 点查trace详情耗时长,用户体验差。
- 链路的未来功能演进需要一次获取多个traceId的详情。例如:通过多个trace详情的联合分析,以智能地定位慢请求根因。
目前点查trace详情的主要耗时来源于下面的sql,用途是获取改traceId下的所有app和开始结束时间。
SELECT
    trace_id,
    groupArrayDistinct(app) AS apps,
    min(start_timestamp_micros) AS min_start_timestamp_micros,
    max(fromUnixTimestamp64Micro(toUnixTimestamp64Micro(start_timestamp_micros) + duration_micros)) AS max_end_timestamp_micros
FROM tracing_span_v2_distributed
WHERE trace_id = '99776aa31c0e3819'
GROUP BY trace_id
SETTINGS use_skip_indexes = 0
我们在clickhouse中执行这样的请求需要耗时8秒(sit环境下,prod环境则在1s以内,尚可接受)
问题分析
分析ClickHouse sql耗时长的手段主要有两个:
- explain查询计划
- 看ClickHouse trace级别的日志
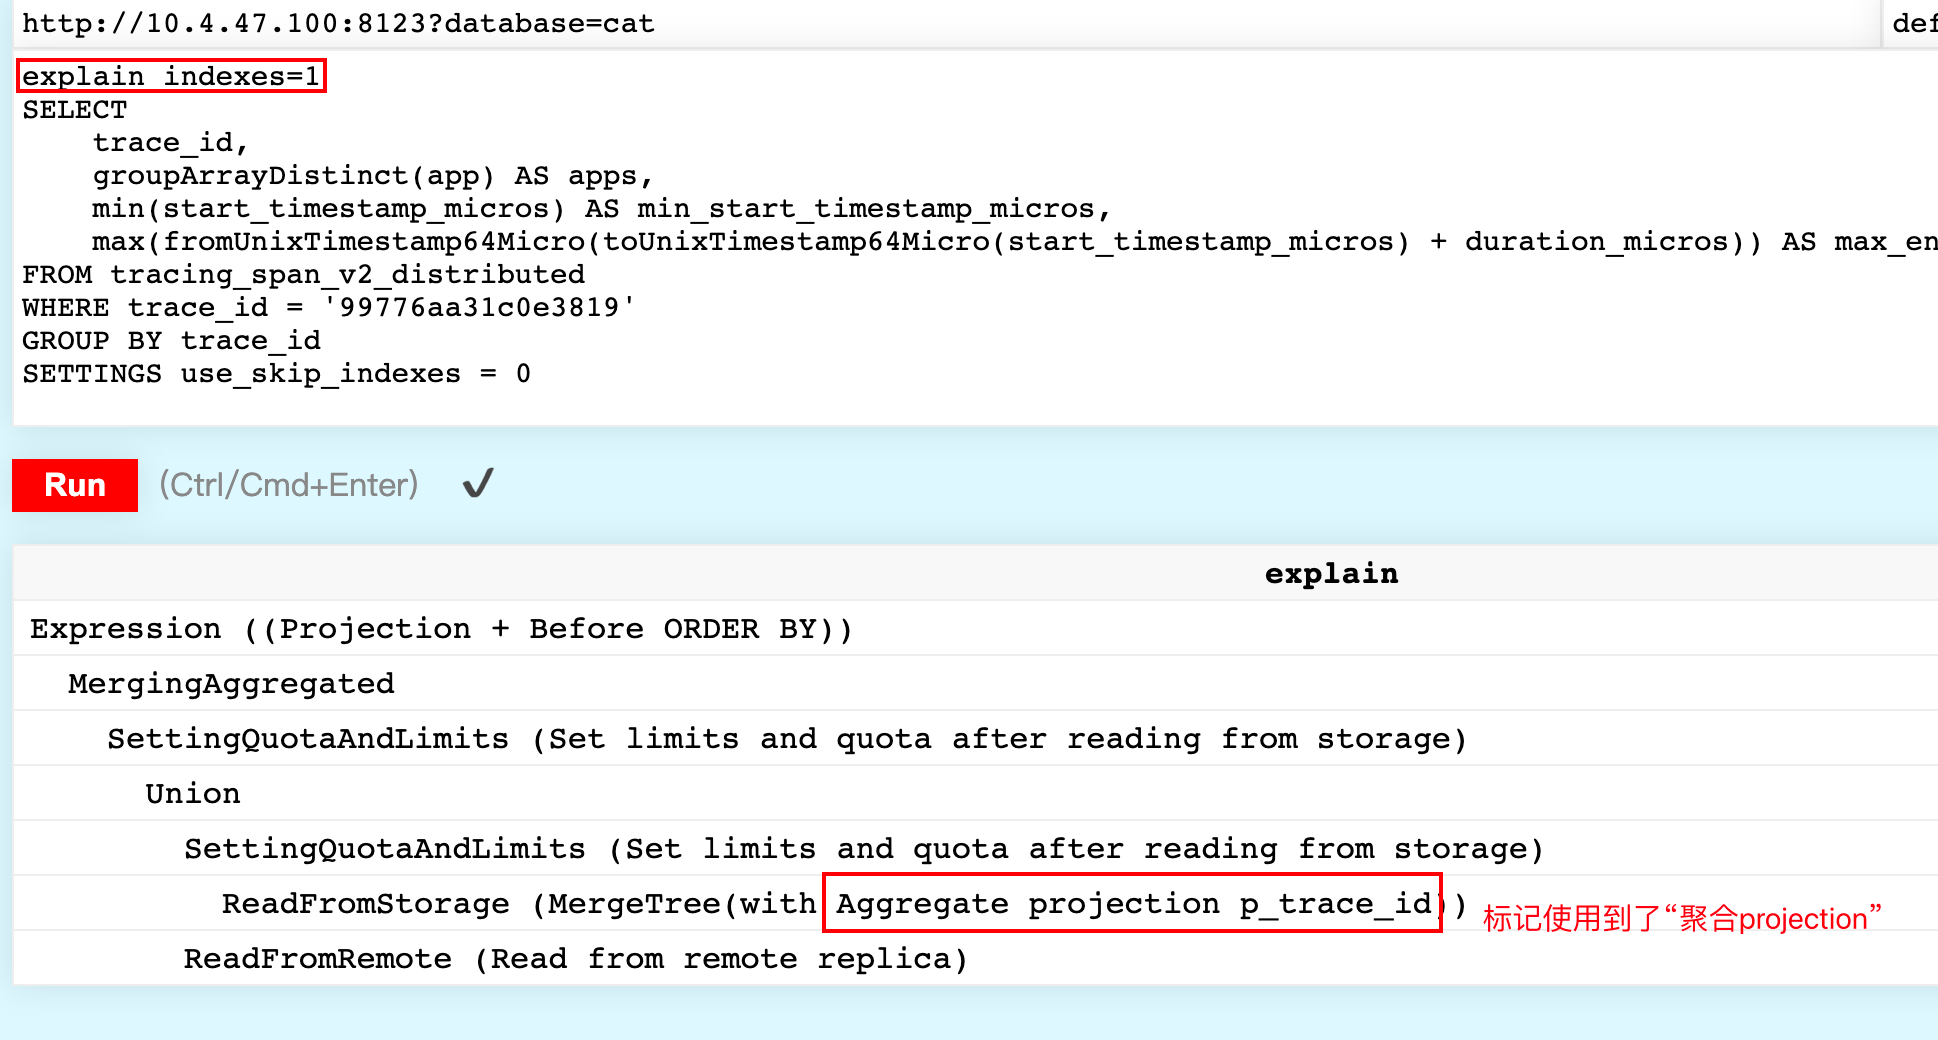
Explain查询计划
通过explain只看到这个查询使用到了projection,这是我们符合我们设计的。
从explain中无法获取更多的信息。
Clickhouse日志
SelectExecutor): Key condition: unknown
SelectExecutor): MinMax index condition: unknown
SelectExecutor): Key condition: (column 0 in ['99776aa31c0e3819', '99776aa31c0e3819'])
SelectExecutor): MinMax index condition: unknown
SelectExecutor): Running binary search on index range for part p_trace_id (1 marks)
SelectExecutor): Running binary search on index range for part p_trace_id (1 marks)
SelectExecutor): Running binary search on index range for part p_trace_id (1 marks)
SelectExecutor): Running binary search on index range for part p_trace_id (1 marks)
............ 对848个part进行二分查找
SelectExecutor): Found (LEFT) boundary mark: 0
SelectExecutor): Found (RIGHT) boundary mark: 1
SelectExecutor): Found continuous range in 3 steps
SelectExecutor): Found continuous range in 0 steps
SelectExecutor): Found continuous range in 19 steps
SelectExecutor): Choose complete Aggregate projection p_trace_id
SelectExecutor): projection required columns: trace_id, groupArrayDistinct(app), min(start_timestamp_micros), max(fromUnixTimestamp64Micro(plus(toUnixTimestamp64Micro(start_timestamp_micros), duration_micros)))
SelectExecutor): Selected 848/848 parts by partition key, 841 parts by primary key, 841/11545564 marks by primary key, 841 marks to read from 841 ranges
SelectExecutor): Reading approx. 6889472 rows with 16 streams
先看日志前四行的 key condition 和 MinMax index condition 。 前两行对应原表,后两行则是projection。
key conditon表示使用primary key过滤part。MinMax index condition表示根据时间类型的MinMax索引过滤part。
补充一点,如果建表语句中 partition by 包含date类型的字段,则也会创建该字段的MinMax索引。
sql查询中有两个相关的settings刚好对应上面两个condition。
force_index_by_date=1, ---- 强制使用date的MinMax索引,否则报错
force_primary_key=1;   ---- 强制使用primary key索引,否则报错
在explain中也能看到key condition 和 MinMax index condition工作的身影,下面会涉及。日志显示这个查询使用了projection中的主键,但无minmax索引可用。这导致扫描了所有的data part,所以耗时很长。
Selected 848/848 parts by partition key, 841 parts by primary key, 841/11545564 marks by primary key, 841 marks to read from 841 ranges
有价值的尝试
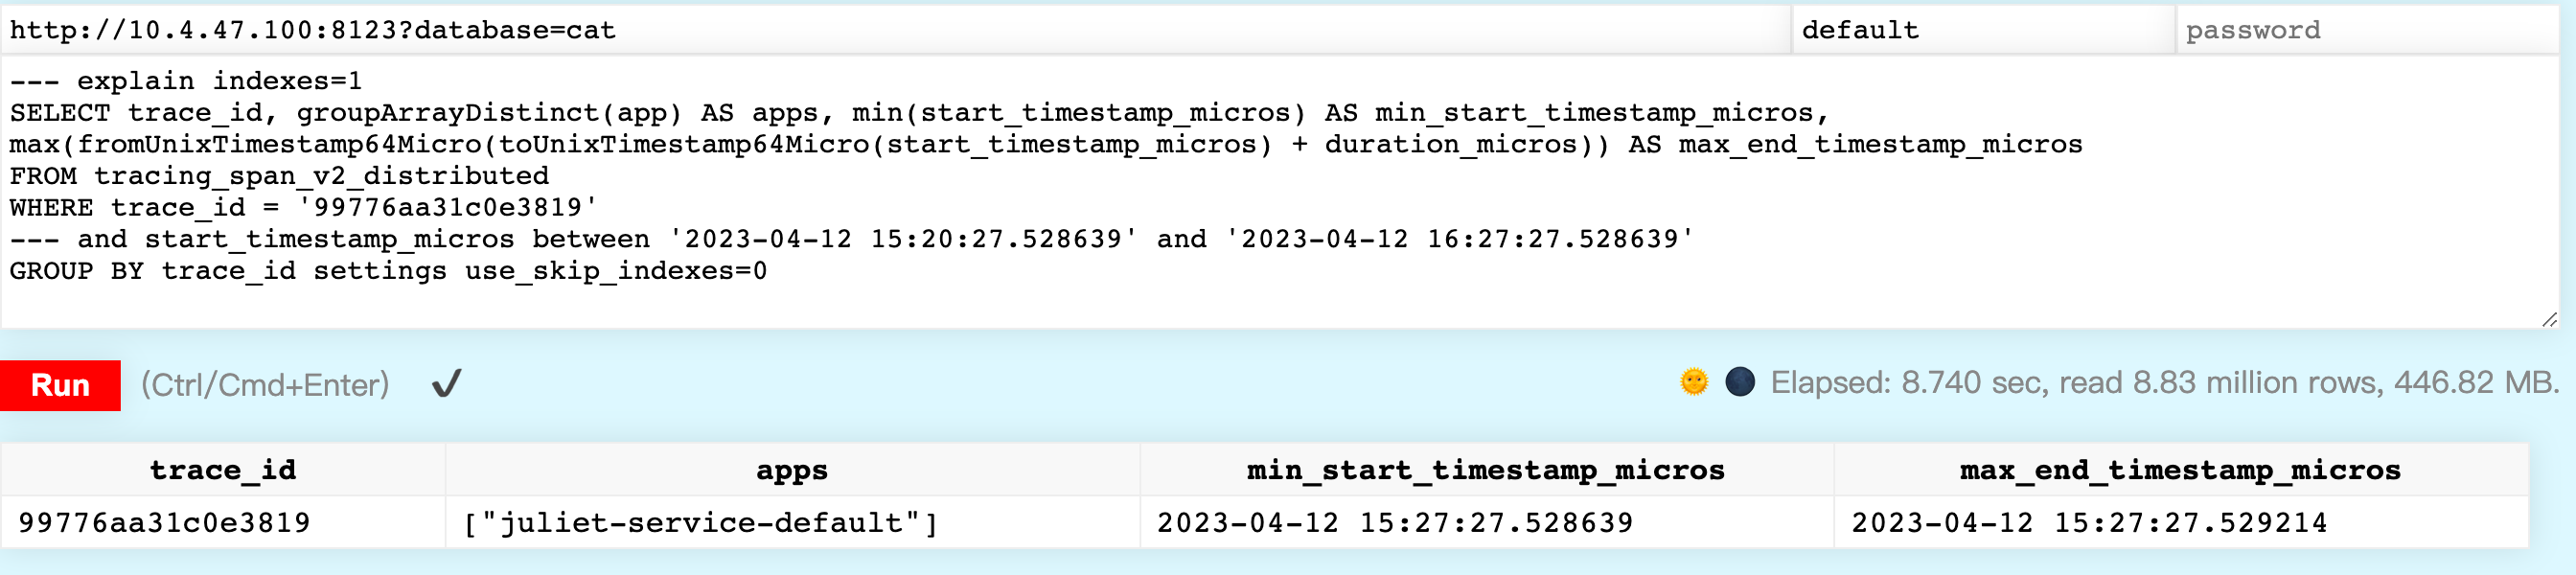
搜索时使用trace_id+时间范围,这样不能使用projection,但是用上了原表的MinMax索引。具体sql如下:
SELECT trace_id, groupArrayDistinct (app) AS apps, min(start_timestamp_micros) AS min_start_timestamp_micros, max (fromUnixTimestamp64Micro (toUnixTimestamp64Micro (start_timestamp_micros) + duration_micros)) AS max_end_timestamp_micros
FROM tracing_span_v2_distributed
WHERE trace_id ='99776aa31c0e3819'
/* 这里增加了时间*/ and start_timestamp_micros >='2023-04-12 15:27:27.528639' and start_timestamp_micros <='2023-04-12 15:27:27.529214'
GROUP BY trace_id
加了时间范围后,耗时从8秒降低至0.2秒,效果很显著。
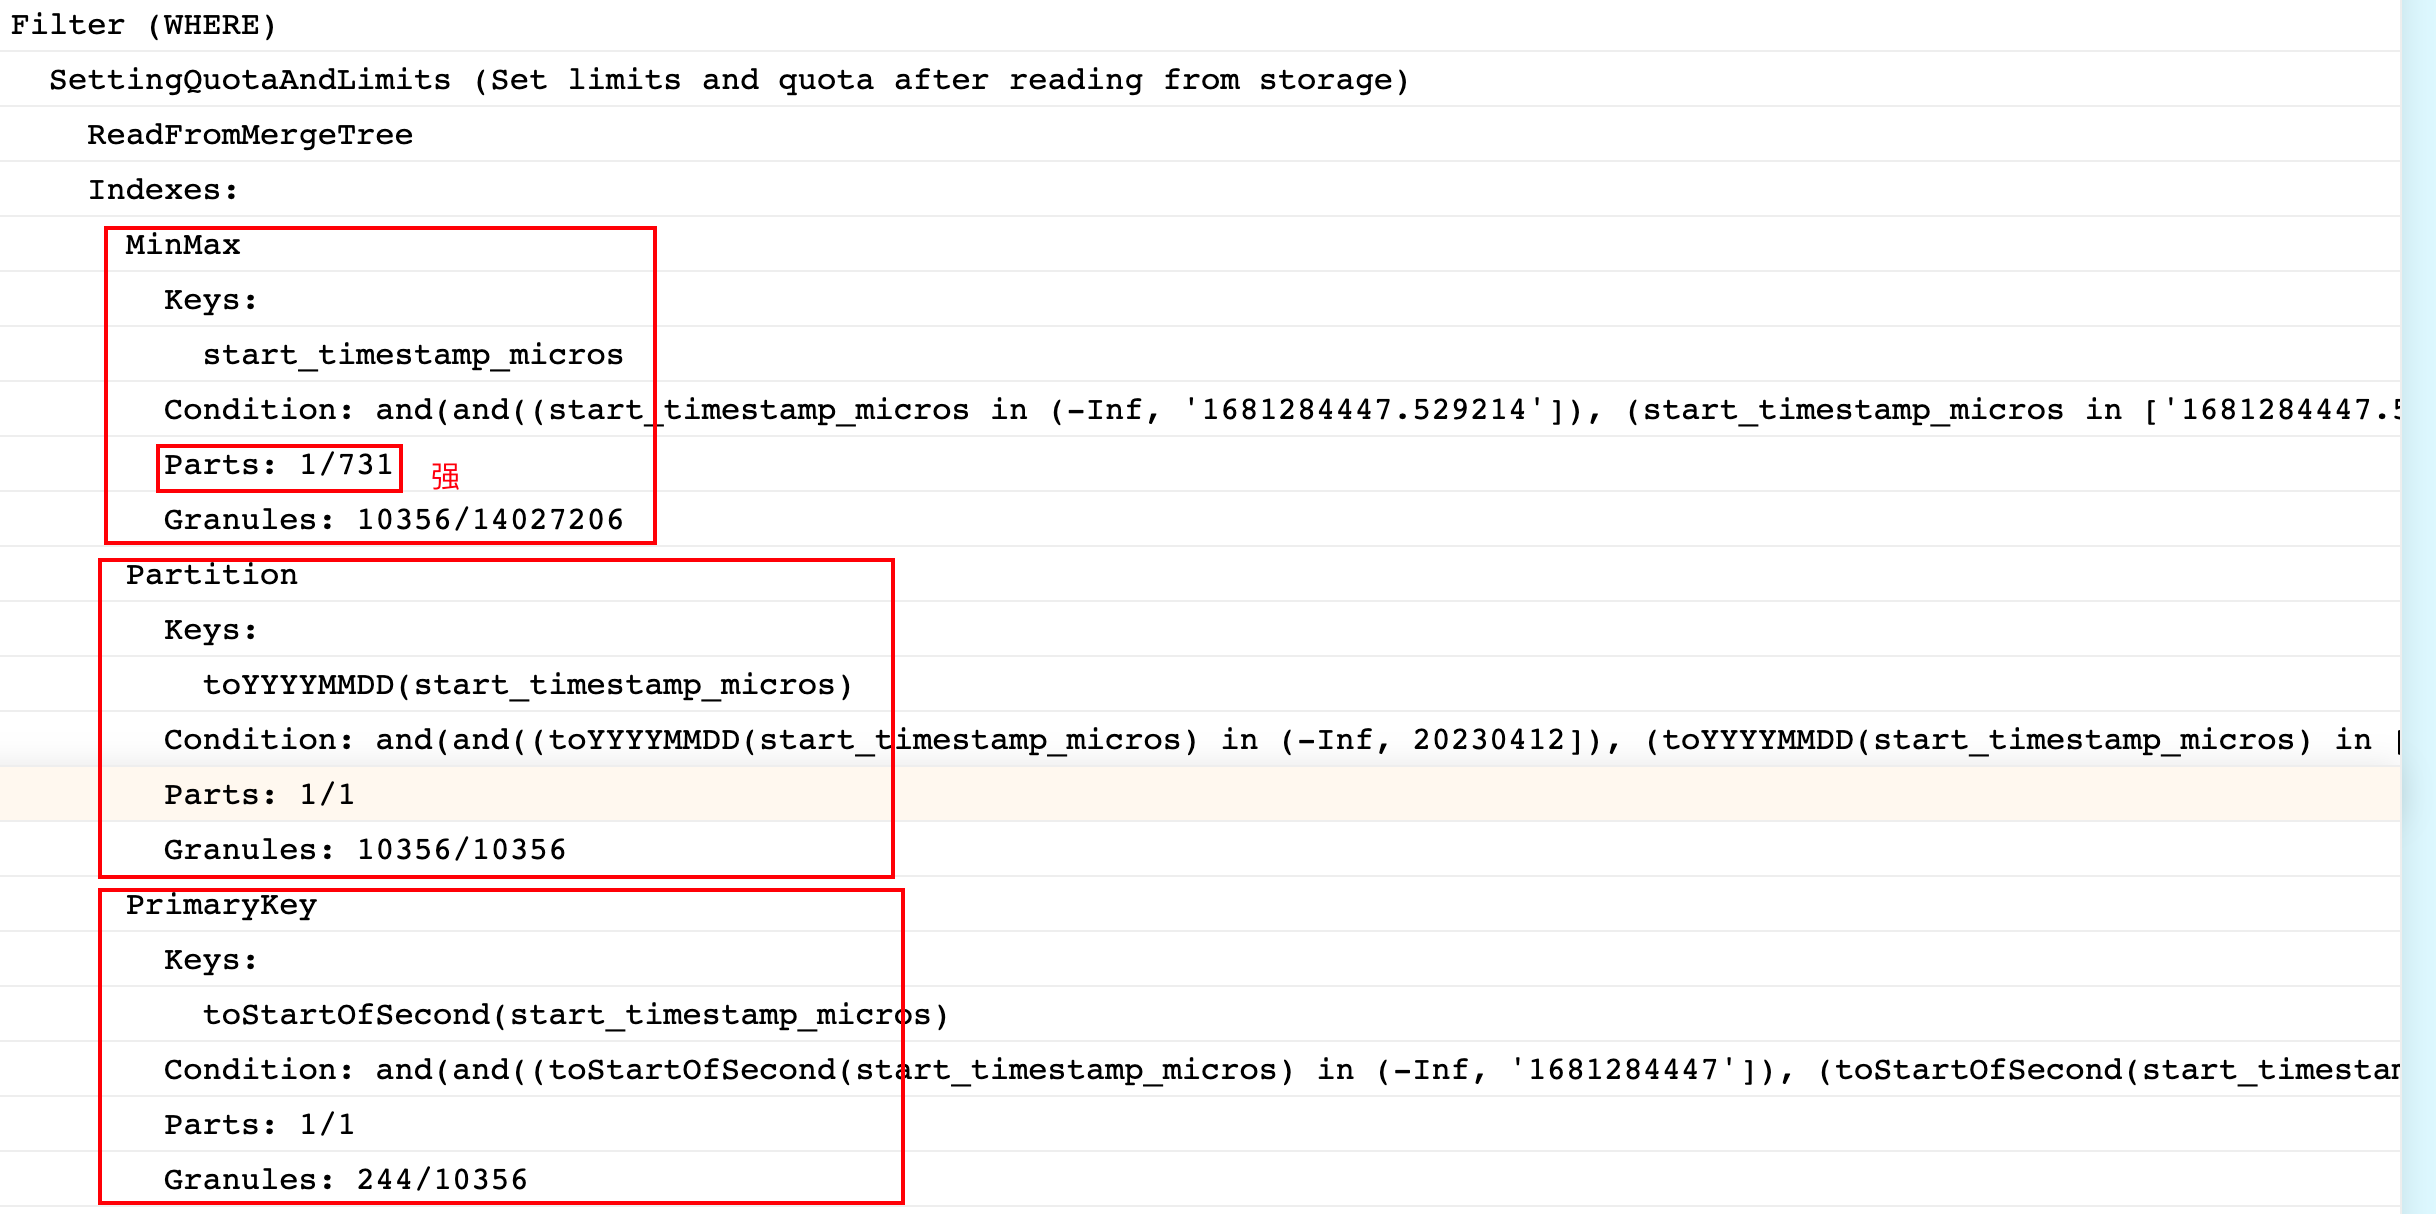
explain查询计划
可以看到第一步根据MinMax索引,第一步就可以过滤掉730个part,只剩下一个part待扫描,这里时间字段的MinMax索引起了大作用。
Clickhouse trace日志
由于截取日志的时间和explain的时间不同,trace日志和explain稍微有些对不上,trace日志扫描了两个part,而不是explain中的一个part,这只是不同时间导致的,不需要关注太多。
值得关注的是,这里 key condition 和 MinMax index condition 都能命中。而后对两个part做了 generic exclusion search (通用排除搜索)而不是二分查找,这是因为where语句中不包含 primary key 的第一列,这里不赘述。
SelectExecutor): Key condition: (column 1 in ['1681284447', +Inf)), (column 1 in (-Inf, '1681284447']), and, unknown, and, (column 1 in ['1681284447', +Inf)), (column 1 in (-Inf, '1681284447']), and, and
SelectExecutor): MinMax index condition: (column 0 in ['1681284447.528639', +Inf)), (column 0 in (-Inf, '1681284447.529214']), and, unknown, and, (column 0 in ['1681284447.528639', +Inf)), (column 0 in (-Inf, '1681284447.529214']), and, and
SelectExecutor): Used generic exclusion search over index for part 20230412_19259427_19277146_12 with 642 steps
SelectExecutor): Used generic exclusion search over index for part 20230412_19179587_19259426_17 with 1887 steps
SelectExecutor): Selected 2/852 parts by partition key, 2 parts by primary key, 463/33841 marks by primary key, 463 marks to read from 261 ranges
SelectExecutor): Reading approx. 3792896 rows with 16 streams
所以,可以确定加了时间范围后,根据MinMax过滤了大量的part,这是耗时降低的主要原因。
当然, generic exclusion search 的性能是不如二分查找的,这里表现还可以的原因是sit环境数据量小,单part的文件size不大,所以通用排除搜索和二分查找性能差距不大。在prod环境下,两者的性能差距就很明显了。这要求我们在实际方案中使用二分查找。
方案评估
方案一)使用KV存储,用于traceId点查的场景
KV存储这种通过对key进行hash寻址的方式特别适合点查的场景,这是此方案合理的原因。
todo
方案二)traceId中包含时间信息,从而在sql中增加时间范围条件,以使用MinMax索引过滤大量Part
方案二是从上面有价值的尝试延伸而来。
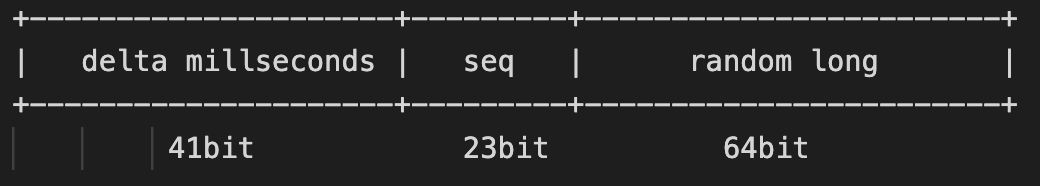
traceId的格式是: 41位时间戳(毫秒)+ 23位序列号+ 64位伪随机long
长度是128bit,输出为base16的字符串(字符串长度为32),这也和opentelemetry的traceId格式对齐。
相关的traceId生成代码如下,其中 recoverTimeFromTraceId 提供了从traceId还原时间的方法,以用于查询sql。
import java.util.Random;
import java.util.concurrent.atomic.AtomicInteger;

public class IdGen {
    private static final AtomicInteger SEQ = new AtomicInteger(0);
    private static volatile Random RANDOM = new Random();

    private static long[] getIdPart(long currentMill) {
        long high = (currentMill << 23);
        int seq = SEQ.getAndIncrement();
        high |= (seq & 0x7fffff);
        long low = RANDOM.nextLong();
        return new long[]{high, low};
    }

    public static String newTraceId(long currentTimeMillis) {
        currentTimeMillis = currentTimeMillis != 0 ? currentTimeMillis : System.currentTimeMillis();
        long[] idPart = getIdPart(currentTimeMillis);
//        return String.format("%016x%016x", idPart[0], idPart[1]); // String.format性能不佳,不使用
        return traceIdFromLongs(idPart[0], idPart[1]);
    }

    public static String newTraceId() {
        return newTraceId(System.currentTimeMillis());
    }

    private static long recoverTimeFromHigh(long high, long currentMil) {
        return (high >>> 23) + (currentMil & 0b0111111111111111111111100000000000000000000000000000000000000000L);
    }

    /**
	 * 同样作用的sql:
	 * with 'c4e22d5e5c90364863af7e06e3c9d9c5' as traceID,
     *     toDateTime(fromUnixTimestamp64Milli(reinterpretAsInt64(reverse(bitShiftRight((unhex(substr(traceID,1,16))),23)))+bitAnd(toUnixTimestamp64Milli(now64()),0b0111111111111111111111100000000000000000000000000000000000000000))) as time
     * select time
	*/
    public static long recoverTimeFromTraceId(String traceId, long currentMill) {
        long high = OtelEncodingUtils.longFromBase16String(traceId, 0);
        return recoverTimeFromHigh(high, currentMill);
    }

    private static String traceIdFromLongs(long traceIdLongHighPart, long traceIdLongLowPart) {
        char[] chars = TemporaryBuffers.chars(32);
        OtelEncodingUtils.longToBase16String(traceIdLongHighPart, chars, 0);
        OtelEncodingUtils.longToBase16String(traceIdLongLowPart, chars, 16);
        return new String(chars, 0, 32);
    }
}
最终方案
最终方案使用方案一和方案二结合的方式。简单描述是:
- 确定新的traceId生成规则,将时间信息编码到traceId中。对于新traceId,直接从traceId中解码出时间信息,以用于MinMax过滤part。
- 由于新的traceId生成规则推动过程中,老traceId还会存在。对于旧格式traceId,使用kv存储老traceId和时间的映射关系。从KV存储中查询到老traceId的时间信息,以用于MinMax过滤part。
- 保证能使用二分查找,而不是通用排除搜索。
下面描述具体方案,分两块描述,Clickhouse设计(表结构、写入和查询)以及KV存储设计
Clickhouse设计
使用新表来存储traceId的app和时间
表结构:
使用SummingMergeTree来做聚合,order by trace_id 从而达到 group by trace_id 的效果。
drop table if exists tracing_trace_id_index on cluster default_cluster;
CREATE TABLE if not exists tracing_trace_id_index on cluster default_cluster
(
    `trace_id`      String,
    `trace_id_time` DateTime, --- 新增的重要字段,用于走MinMax索引
    `apps` SimpleAggregateFunction(groupUniqArrayArray,Array(String)),
    `min_start_timestamp_micros` SimpleAggregateFunction(min,DateTime64(6)),
    `max_start_timestamp_micros` SimpleAggregateFunction(max,DateTime64(6)),
    `errors`        Int32
)
    ENGINE = SummingMergeTree
        PARTITION BY toDate(trace_id_time)
        order by trace_id
        TTL toDate("trace_id_time") + INTERVAL 30 DAY DELETE;

CREATE TABLE if not exists tracing_trace_id_index_distributed on cluster default_cluster
(
    `trace_id`      String,
    `trace_id_time` DateTime, --- 新增的重要字段,用于走MinMax索引
    `apps` SimpleAggregateFunction(groupUniqArrayArray,Array(String)),
    `min_start_timestamp_micros` SimpleAggregateFunction(min,DateTime64(6)),
    `max_start_timestamp_micros` SimpleAggregateFunction(max,DateTime64(6)),
    `errors`        Int32
)
 ENGINE = Distributed('default_cluster', , 'tracing_trace_id_index', rand());
因为clickhouse-http-java的0.3.2版本并不支持
groupUniqArrayArray类型的SimpleAggregateFunction聚合函数,相关支持在此PR (代码很简单),已升级到0.4.4版本来引入该修复PR。
写入过程:
- 判断是新traceId还是老traceId:长度为32位的16进制字符串并且从前41位还原出的时间戳在前后最近的一小时内,则认为是新traceId,否则为老traceId。
- 对于新traceId,一个traceId对应一个时间。collector从traceId中解码出该时间,并将这个时间作为trace_id_time写入ClickHouse。
- 对于老traceId,不能从traceId还原出唯一的时间,只能记录span开始时间。而且一个traceId将记录到多个span开始时间。我们将traceId和时间的mapping分别写入ck和Redis。因为被选中而写入ck的时间可能不同,所以select语句中时间范围是加减一小时。
在描述写入过程中时间是如何被处理的后,就可以确定我们的查询语句。
查询语句:
select trace_id,
       trace_id_time,
       groupUniqArrayArray(apps) as apps,
       min(min_start_timestamp_micros) as min_start_timestamp_micros,
       max(max_start_timestamp_micros) as max_start_timestamp_micros,
       sum(errors) as errors
from tracing_trace_id_index
where
/*对于老traceId,范围查询,加减一小时*/trace_id_time between #{traceIdTime} - toIntervalHour(1)) and #{traceIdTime} + toIntervalHour(1))
/*对于新traceId,时间点查*/ ---trace_id_time =#{traceIdTime}
and trace_id = #{traceId}
group by trace_id, trace_id_time;
查询日志:
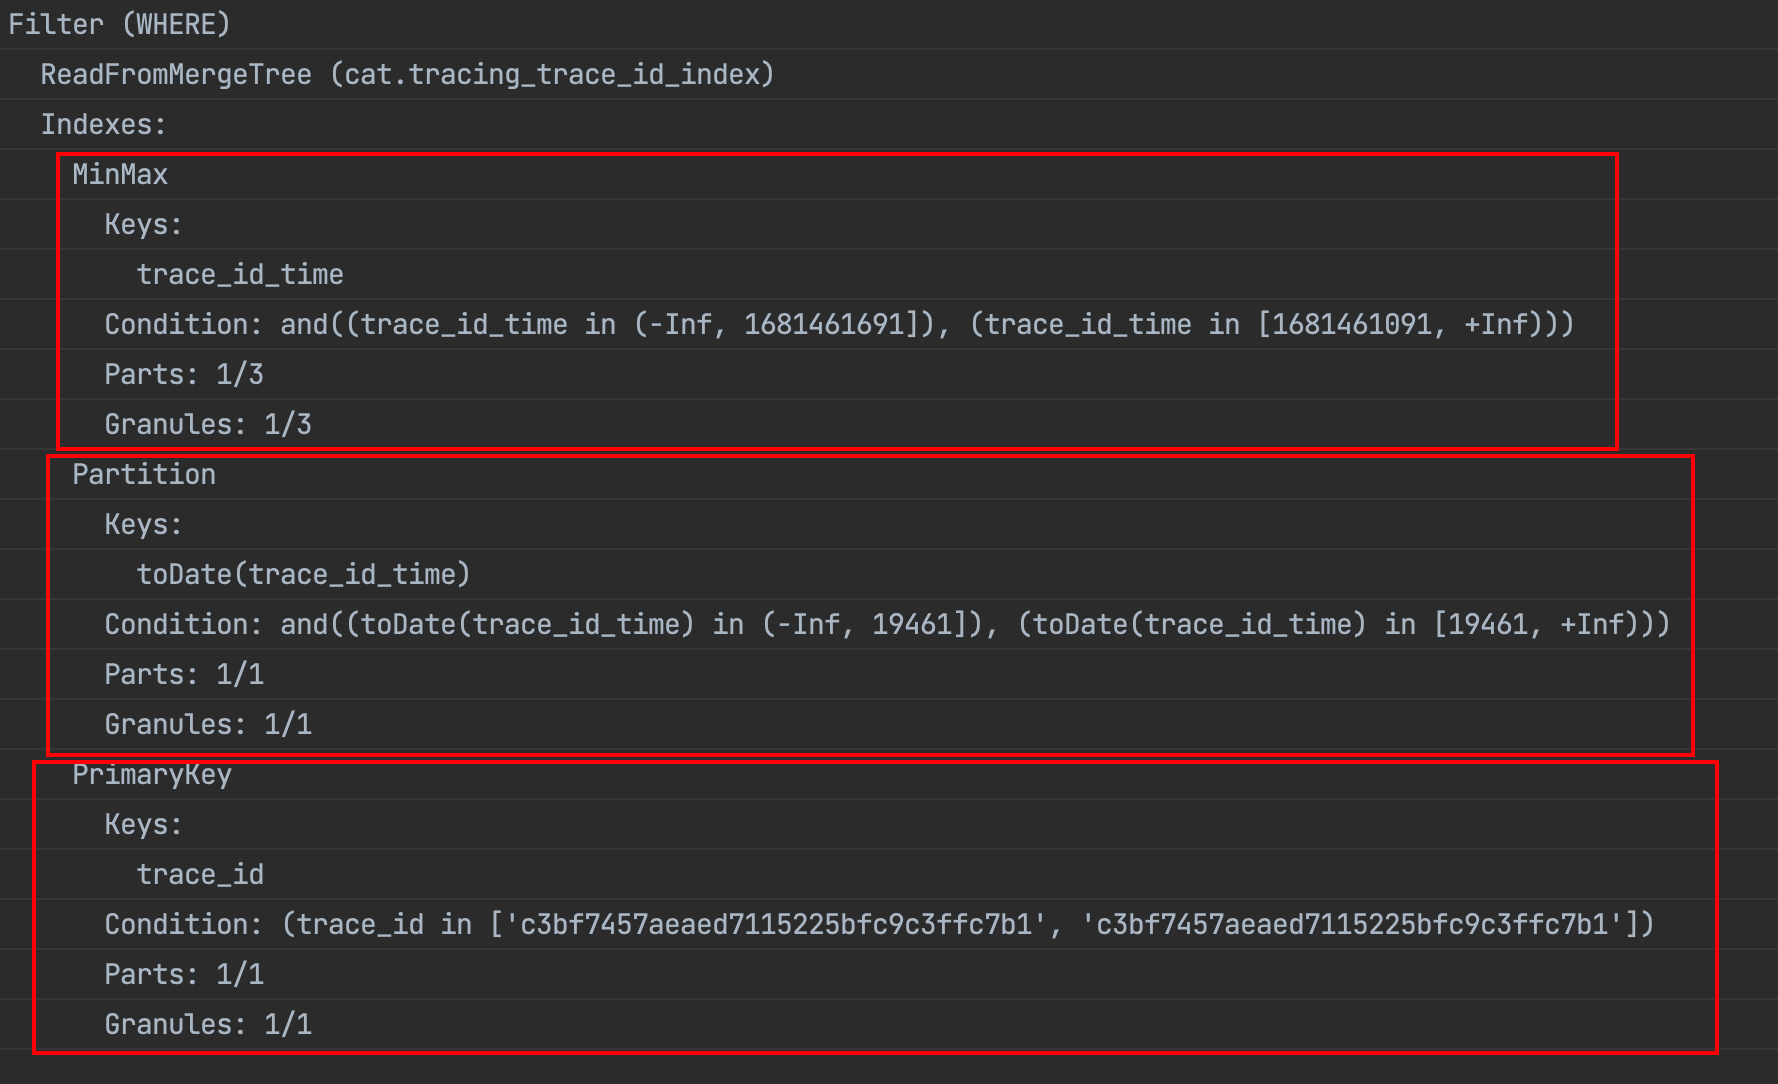
可以看到即用到了 key condition 又用到了 MinMax index condition 并且最后执行的是二分查找,可以说是最佳的情况了。
SelectExecutor): Key condition: (column 0 in ['c3bf7457aeaed7115225bfc9c3ffc7b1', 'c3bf7457aeaed7115225bfc9c3ffc7b1']), unknown, unknown, unknown, and, and, and
SelectExecutor): MinMax index condition: unknown, (column 0 in [1681461091, +Inf)), (column 0 in (-Inf, 1681461691]), and, and, unknown, and
SelectExecutor): Running binary search on index range for part 20230414_1_2113_853 (2 marks)
SelectExecutor): Found (LEFT) boundary mark: 0
SelectExecutor): Found (RIGHT) boundary mark: 1
SelectExecutor): Found continuous range in 2 steps
SelectExecutor): Selected 1/2 parts by partition key, 1 parts by primary key, 1/1 marks by primary key, 1 marks to read from 1 ranges
SelectExecutor): Spreading mark ranges among streams (default reading)
explain:
KV存储设计
使用redis的SETNX traceId timestamp
迭代规划
迭代一 完成对新traceId的查询加速 【已完成】
- 确定新traceId生成的Java代码,并给到IOS、安卓、web端
- 开发根据新traceId还原时间的代码
- 将新traceId索引写入ck
- 新traceId的详情查询走traceId索引
迭代二 使用Redis完成对老traceId的查询加速
- Redis容量评估 【已完成】100万qps,应该满足不了
- 申请Redis资源
- 老TraceId写入时间写入Redis
- 从Redis查询老traceID对应的时间